The Victorian Government has released maps showing the possible effects of sea level rises on vulnerable coastal regions over the next 100 years.According to these maps some townships could become submerged during extreme storm events, as water levels rise over the next century. Portland, Port Fairy, Port Phillip, Barwon Heads, Tooradin and Seaspray regions are the most risk prone areas.The study reveals that the sea levels during extreme storms could rise anywhere between 80 centimetres and 1.4 metres, over the next century. The Environment Minister, Gavin Jennings said that the study is more accurate than a similar Commonwealth study released on the weekend. More detailed reports are expected to be released by next year.
Showing posts with label maps. Show all posts
Showing posts with label maps. Show all posts
Wednesday, November 25, 2009
Monday, June 22, 2009
NASA Scientists Bring Light to Moon's Permanently Dark Craters

A new lunar topography map with the highest resolution of the moon's rugged south polar region provides new information on some of our natural satellite's darkest inhabitants – permanently shadowed craters. The map was created by scientists at NASA's Jet Propulsion Laboratory, Pasadena, Calif., who collected the data using the Deep Space Network's Goldstone Solar System Radar located in California's Mojave Desert.
Friday, May 22, 2009
Bangalore sewerage board implements GIS in core area 14 May 2009
Bangalore Water Supply and Sewerage Board (BWSSB) has implemented GIS in the core city area. This is the biggest e-governance initiative of the Board and it will take another two years to complete the entire BBMP limits. The GIS will help BWSSB to store, access, query and analyse data, which in turn will help to take quick management decisions.The BWSSB has been working on the GIS for the last seven years. So far, the board has updated all details covering the 229 sq km of the core city and is in process of dovetailing the GIS with revenue billing, employee database and other details. According to the BWSSB officials, the data related to the newly added areas of the city would be updated in the GIS by 2011. GIS performs four kinds of operations — data integration, data storage, data processing and data outputs. Data processing includes data viewing, data querying, data crossover and spatial analysis.At present, 22 layers of information are available with BWSSB. The most important among them are water supply features like water pipes, valves, reservoirs, fire hydrants, and pumping and sewage features like sewers, manholes, connections in cross roads, consumers, administrative boundaries and BWSSB offices.GIS provides solutions to implementing a sustainable and durable water supply and sewerage network management information system, and acquiring geographic description and analytical knowledge of BWSSB’s assets, both over ground and underground.
Source : http://www.expressbuzz.com
Monday, May 18, 2009
Israel, China to map the world
Survey of Israel – the National Agency for Geodesy, Cadastre, Mapping and Geographic Information – has signed an agreement for cooperation with the Chinese government's Bureau of Surveying and Mapping. The deal was signed as part of the International Federation of Surveyors (FIG) convention which is being held in Eilat this week and is attended by some 600 representatives from Israel and more than 60 other countries. The deal signed Monday was an agreement on principles for the cooperation, which will be defined in detail during talks held in the near future. This was the first agreement of its kind to be signed between the Chinese Mapping Center and a Western body.The agreement will lead to technological cooperation between the two countries in all mapping fields, including mapping via satellite, mapping of the earth, satellite mapping for GPS, mapping of automatic processes related to geographic processes, real estate mapping, etc. The head of the Chinese organization stressed that one of its main goals was to sign similar agreements with the West. The director of Survey of Israel briefed the Chinese guests on the fields the center deals with, and future cooperation was discussed. Source : http://www.ynetnews.com/
Monday, December 15, 2008
CRRI’s 'Hawk Eye' on Indian roads

At first sight, one can mistake this vehicle to be an ultra tech robotic remote-controlled vehicle, but it is the country's first 'Hawk Eye' that is surveying almost 50,000 kilometres of country's highways and roads to gauge their quality and see if they are fit for freight movement and travel. The database will be used to create GIS maps of highways in the country. The project is being undertaken by Central Road Research Institute (CRRI) and GIS survey and global positioning system (GPS) will help better navigation across the country.
Mounted on a jeep, the Hawk Eye's instrumentation system includes a laser profiler along with pavement view cameras to measure road surface, collect and process digital images of pavements and other roadside elements. The vehicle has been used in countries like China, Malaysia, Singapore, South Korea and Thailand. Hawk Eye requires high-speed paved roads for operation and is sensitive to rough weather conditions like dust storms and heavy rains. It can gather data while travelling at a speed of 30 to 100 km per hour.
An advantage Hawk Eye enjoys over other instruments with CRRI is its ability to look at the surface of the road and measure cracking areas. Any area with a crack of above three centimetres is detected by the vehicle's sensors and a preventive measure is suggested by the computers. This helps improve life of highways, which is normally around 20 years in the case of bitumen roads.
Source : http://timesofindia.indiatimes.com
Thursday, December 4, 2008
A global view of HIV infection

llustration: GfK GeoMarketing”
To mark World AIDS Day on December 1, GfK GeoMarketing is provided a map that illustrates the global distribution of HIV cases (data source: WHO/GfK GeoMarketing; map: GfK GeoMarketing).
According to the latest statistics from the World Health Organization (WHO), the highest rates of infection occur in southern Africa and the Russian Federation.
Monday, September 29, 2008
World's Biggest Atlas
Copies of the largest world atlas ever produced have gone on sale at an earth-shattering price of £2,000 each.
Dubbed “the ultimate book about our world”, the luxurious, limited edition Earth is hand-bound in leather with gilded edges and silver-plated corners.
The atlas and its case together weigh 30kg – more than the maximum many airlines set passengers for their baggage allowance.
The 576 pages contain 154 maps and 800 photographs backed with detailed descriptions of every country’s geography, history and culture. Lying closed, the atlas takes up a third of a square metre with four gatefolds opening out to two square metres each.
Ten cartographic experts at the British map company Global Mapping spent eight months compiling Earth with more than 100 overseas colleagues including fellow map makers, geographers and oceanographers. They worked with detail from a continuously updated world database of digital mapping.
Global Mapping’s Alan Smith said: “We all had to keep to the same, consistent specification to make sure everything tied in universally from the way we shaded hills to the presentation of political geography. The sheer physical size of the atlas is amazing. The overall content, including the maps, text and photographs, is very much more detailed than any other atlas ever produced.”
Only 3,000 hand-numbered copies of Earth have been made – one for every 3.3 million people in the world. The atlas is expected to appeal to specialist collectors, libraries, rich individuals with a penchant for mapping and companies seeking lavish, once-in-a-lifetime corporate gifts. Taking the exclusive level even higher, one thousand copies from the print run have had their covers redone in gold leather with gold plated corners at the request of distributors in the Middle East.
Earth is the brainchild of Australian map publisher Gordon Cheers who has already received several hundred orders for copies. He described it as “a time capsule of where we are in the world today”.
The atlas may be impressive but its 30kg weight still pales into insignificance when compared to the mass of the planet itself – estimated at an unpronounceable 6,000,000,000,000,000,000,000,000 kg.
Earth can be order via Worlds Biggest Atlas
Global Mapping publishes a range of wall maps and supplies maps for travel guides, book packaging, planning applications and many other activities in business, government and leisure. Based in Northamptonshire, the company has a wealth of experience in mapping for print, CD, GIS and Internet.
source
Monday, August 25, 2008
Finding You on a Map

By far the easiest way to determine where you are on a map is to pull out your pocket GPS (global positioning system receiver) and have it give you your map coordinates. If, however, you are like a lot of people, you don’t want to shell out a few hundred bucks for a GPS and, unless you are in an area with very little topographic relief, you don’t need one. You can determine your position quite accurately on a topographic map by using your compass to triangulate between three points.
The first step in triangulation is to pick three topographic features that you can see and can identify on your map (mountains are ideal). Start with the first feature you have chosen and determine the bearing between you and it, as outlined above. Once you have determined its bearing, pencil in a line with the same bearing on your map that runs through the chosen feature (having a protractor would be useful).
Repeat this for the other two features, drawing lines for each. The point where the three lines intersect on the map is where you are. Depending on how accurate your sightings were and how accurately you drew your lines through the features, there will probably be a some error in your location. Be sure to double check the map and reconcile it with what you see. If the lines intersect in a valley and you are on a hill, the location is obviously off a bit on the map.
source
Wednesday, August 20, 2008
Map Projections and Distortions

What is a Map?
Once a reference datum has been determined the elevation of any point can be accurately determined, and it will correlate to the elevation of any point on the earth's surface that has the same elevation and is using the same datum. But…how do you accurately represent the X and Y coordinates of that point? This question leads to one of the fundamental problems of mapmaking…how do you represent all or part of an ellipsoid object on a flat piece of paper? The answer to this question is a bit complicated, but understanding it is fundamental to understanding what maps actually represent (this statement will become clearer shortly).
In order to represent the surface of the earth on a flat piece of paper, the map area is projected onto the paper. There are many different types of projections, each with its own strengths and weaknesses.
 The simplest (and easiest to visualize) example of a projection is a planar projection. To understand this type of projection, imagine inserting a piece of paper through the earth along the equator. Now imagine that the earth is semi-transparent and you could shine a flashlight oriented along the (geographic) polar axis through the earth.
The resulting outline on the paper would be a map created using this type of projection (known as a transverse azimuthal or planar projection).
There are three main types of projections, based on the shape of the 'paper' onto which the earth is projected. The example above used an azimuthal (planar) piece of paper.
The other main types, illustrated to the right, are cylindrical and conical projections. These three types of projections can be further modified by the way the 'paper' is oriented when it is inserted into the earth.
In the example above, the plane was oriented along the equator, known as a transverse orientation (hence the 'transverse azimuthal' projection). Projections may also be equatorial (oriented perpendicular to the plane of the equator) or oblique (oriented at some angle that is neither parallel nor perpendicular to the plane of the equator.
Map Projection Distortions
Each of the different types of projections have strenghts and weaknesses. Knowledge of these different advantages and disadvantages for a particular map projection will often help in which map to choose for a particular project. The basic problem inherent in any type of map projection is that it will result in some distortion of the ‘ground truth’ of the area being mapped.
Any place on the map that does not lie along this line will suffer some distortion. Fortunately, depending on the type of projection used, at least one of the four characteristics can generally be preserved.
A conformal projection primarily preserves shape, an equidistant projection primarily preserves distance, and an equal-area projection primarily preserves area.
These image show the earth using different projections. Notice how the continents look stretched or squashed depending on the projection. Following are some websites with more information.
Thursday, July 31, 2008
Ancient India:Maps

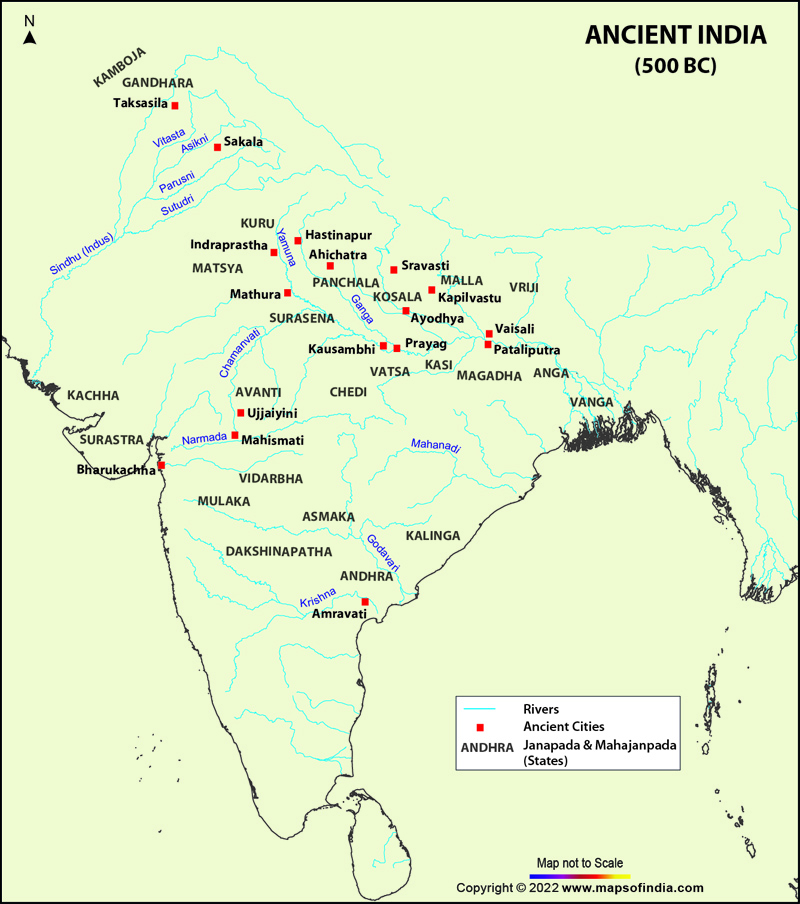
One of the readers asked for the map of ancient india.
The history of India is shrouded in antiquity. The country has been thought of as a nation of philosophers with a well-developed and even idyllic society. Excavations of sites belonging to the Harappan era show that the people lived in brick houses in towns with excellent drainage. One of the oldest scriptures in the world is the four volume Vedas that many regard as the repository of national thoughts that anticipated some of the modern scientific discoveries. Despite formidable barriers in the form of the mighty Himalayas and oceans, India also received a succession of foreigners, many of them carrying swords and guns. But nearly all of them stayed on. Out of these waves of immigration has emerged the composite culture of India and made it a land of unity in diversity. India became a land of assimilation and learning, a land of change and continuity. According to the one school of thoughts, the Aryans were among the first to arrive in India, which was inhabited by the Dravidians. Others who came here included Greeks, Persians, Mughals and even British, Portuguese and French. Over the years there have been many major ruling dynasties like the Shakas, the Kushans, the Maurayas and Guptas. Nearly every major religion in the world is represented in India. It is also the land of Lord Buddha, Lord Mahavira and Guru Nanak Dev, the founders of Buddhism, Jainism and Sikhism.
Subscribe to:
Posts (Atom)